

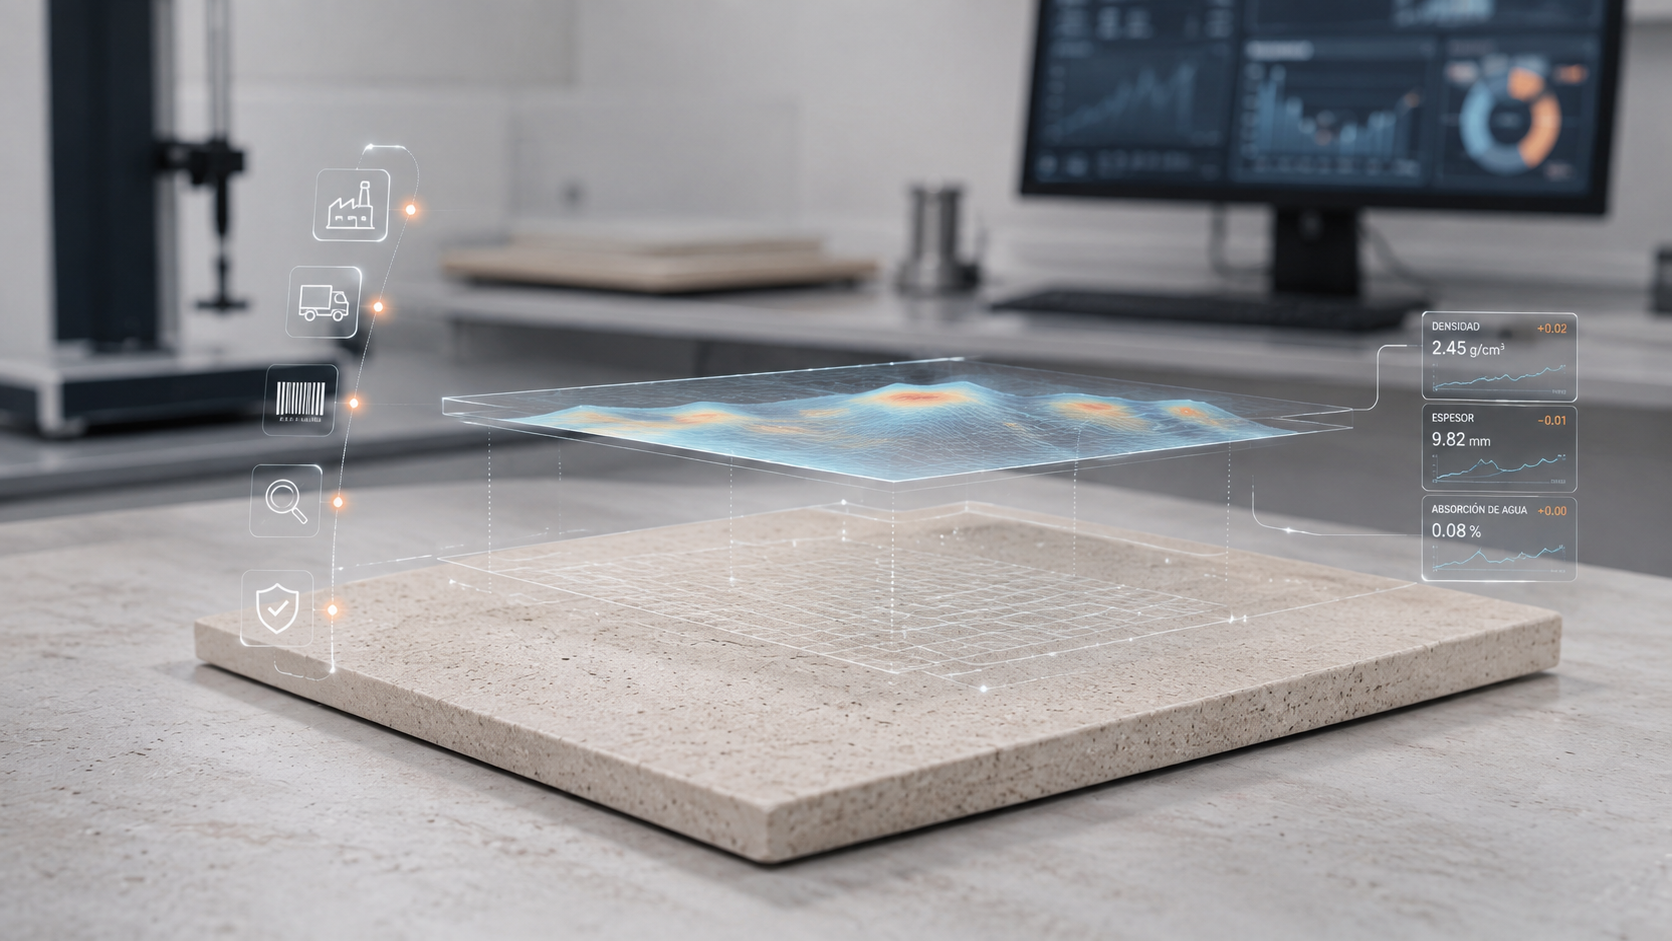
A ceramic plant can generate thousands of data points every day.
Pressing pressures. Atomized powder moisture. Temperatures. Speeds. Feeding parameters. Drying and firing curves. Dimensional measurements. Laboratory results. Classification data. Density maps.
But having a large amount of data does not mean having a digital twin.
The challenge is not only to capture data, but to transform it into quality information capable of improving efficiency and competitiveness through its contextualization, correlation and analysis.
For this information to truly help us understand the process, we first need to know which product it corresponds to, when it was generated and under what manufacturing conditions.
And if we want to go one step further, moving from the analysis of what happened towards predictive quality, we must be able to relate the initial state of the piece with its subsequent evolution.
The question then is no longer only:
What happened during manufacturing?
but becomes:
Can we use what we know now to anticipate what could happen next?
This is one of the major challenges posed by the digital twin in the ceramic industry.
It is not simply about digitizing a factory or visualizing real-time data. It consists of building a digital representation sufficiently connected to the physical process to understand its behaviour, study scenarios and, at more advanced levels, support decisions before a deviation occurs.
The ISO 23247 family of standards establishes a specific framework for the application of digital twins in manufacturing. The standard considers the creation of digital representations of observable elements of the production system and the integration of the necessary information to work with them.
In the ceramic industry, this interest is particularly relevant because the product continuously changes as it moves through the process.
A pressed tile is not yet the tile that will come out of the kiln.
Between these two states, changes occur in moisture, densification, shrinkage, thermal transformations and dimensional modifications. Understanding how these stages are related is the basis for building increasingly predictive quality.
What is a digital twin in manufacturing really?
The term digital twin is frequently used to describe very different solutions.
A 3D model of a machine can be presented as a digital twin.
A dashboard with real-time variables, a process simulation or a historical database can also be considered a digital twin.
However, not all these systems represent the same level of integration between the physical and digital worlds.
The series ISO 23247 provides a specific framework for digital twins in manufacturing. Its first part establishes the general principles and requirements of the framework, while other parts develop the reference architecture, the digital representation of manufacturing elements and information exchange.
The evolution of this family of standards also shows that the challenge is no longer limited to building an isolated digital representation.
The ISO 23247-5:2026 introduces the concept of digital thread or digital thread to connect, manage and maintain digital twins throughout the product life cycle.
The ISO 23247-6:2026, for its part, addresses the composition of different digital twins and their interoperability.
This is especially interesting in a ceramic factory.
There does not have to be a single model representing absolutely the entire plant.
Digital representations could coexist of:
- Equipment.
- Processes.
- Raw materials.
- Products.
- Energy systems.
- Quality systems.
The value appears when these elements can share information and retain the relationships necessary to interpret what is happening.
Digital model, digital shadow and digital twin: they are not exactly the same thing
The ASEBEC 4.0 Guide, developed specifically for the digital transformation of the ceramic sector, establishes a useful distinction according to the degree of integration existing between the physical process and its digital representation.
Digital model
It is a representation of the process or product without automated exchange of information with the physical system.
This can be, for example:
- A mathematical model.
- A simulation.
- A geometric representation.
- A physical model of the behaviour of equipment or material.
It can be extremely useful, but its data is not automatically updated based on what occurs in the factory.
Digital shadow
An automated flow of information exists from the physical process towards the digital representation.
When the real process changes, the digital model receives that information and updates its state.
The flow, however, is fundamentally unidirectional.
Digital twin
In the classification used by the ASEBEC 4.0 Guide, the level of integration increases to allow a more complete connection between both environments, where there can be an exchange of information and actions between the physical and digital systems.
This distinction is important because it avoids calling digital twin any system that simply displays information.
Visualizing the process is not the same as modeling it.
And modeling it does not automatically mean we can predict it either.
Traceability is the first requirement
Before trying to anticipate the behavior of a tile, we must be able to reconstruct its history.
Imagine a plant where the following are correctly recorded:
- Spray-dried powder moisture.
- Pressing pressure.
- Dryer temperature.
- Kiln curve.
- Final caliber.
- Planarity.
All those data points can be precise.
But if we cannot establish which conditions affected each tile, pressing or batch, their ability to explain a given result is considerably reduced.
Therefore, traceability is not the same as a digital twin, but it constitutes one of its fundamental foundations.
The ASEBEC 4.0 Guide itself identifies information decentralization and the existence of different “data islands” as one of the main obstacles to building a digital twin in a ceramic factory.
A sufficiently detailed traceability should allow answering questions such as:
- Which raw material was this piece manufactured with?
- At what moment was it pressed?
- Which process configuration was active?
- What properties did it present before drying and firing?
- What thermal conditions did it experience?
- What was its final dimensional behavior?
- Was it ultimately classified as first quality?
- Did it subsequently present breakage, curvature, or caliber deviation?
When we can maintain these relationships, we stop working solely with independent data.
We start building the digital history of the product.
Traceability, monitoring and predictive quality answer different questions
It is useful to separate concepts.
| Level | Main question | Result |
| Data capture | What are we measuring? | Values coming from equipment, sensors and controls |
| Traceability | Which tile, batch and moment does each data point belong to? | Relationship between product and manufacturing conditions |
| Monitoring | What is happening? | Visibility of the current state of the process |
| Technical analysis | What relationships appear between variables? | Identification of patterns and hypotheses |
| Simulation | What would happen under certain given conditions? | Evaluation of scenarios using a model |
| Predictive quality | What result is reasonable to expect? | Estimation of trends, probabilities or future behaviors |
| Optimization | Which decision can improve the result? | Support for action on the process |
This table should be understood as a conceptual classification to explain the progression of data usage, not as an official taxonomy of the ISO standard or ASEBEC.
The important thing is to understand that higher levels depend on the previous ones.
An advanced algorithm cannot automatically compensate for deficient traceability.
And a predictive model built on poorly contextualized data can be mathematically sophisticated and, at the same time, of little use for production.
Why the green state is especially important
The tile entering the kiln already contains a manufacturing history.
During feeding and pressing, heterogeneities associated with, among other factors, the following may appear:
- Powder distribution.
- Filling conditions.
- Deaeration.
- Applied pressure.
- Mold geometry.
- State of certain components.
These differences can translate into non-homogeneous distributions of density, thickness or mass. For this reason, measuring bulk density after compaction provides particularly relevant information on the initial state with which the tile will continue to subsequent stages.
Tekinn's technical documentation links these heterogeneities to different subsequent behaviors during drying, glazing, firing or mechanical processes.
This does not mean that observing a heterogeneity automatically allows identifying the final defect.
Nor does it mean that a given distribution always has a single cause.
It means something more useful from a technical point of view:
the initial state of the piece contains information that can help us understand its subsequent behavior.
And that information can form part of the digital history of the tile.
From average value to map
For a quality-oriented digital twin, storing a single number per tile is not always sufficient.
Suppose:
Average density: 1.96 g/cm³.
That value allows comparing production runs and observing trends.
But it does not indicate where the mass is located.
It does not show whether a transverse band exists.
It does not distinguish between center and edges.
It does not reflect a gradient.
It does not reveal whether two tiles with the same average present completely different distributions.
The X-ray absorption technology for verifying the compaction of ceramic parts, combined with thickness measurement, allows non-destructively obtaining bulk density maps in large-format ceramic tiles. The work of Amorós et al. published in 2010 developed precisely this methodology to determine density distributions in large-sized pieces.
At Tekinn we use this principle to characterize the pressed piece and obtain information on the distribution of density, thickness, and mass.
The conceptual difference is important:
A figure summarizes.
A map preserves the spatial distribution.
This difference is particularly relevant in large formats, where inspecting the complete tile makes it possible to identify patterns and heterogeneities that might remain hidden among just a few measurement points.
A density map is not yet a digital twin
This distinction deserves to be made explicit.
Obtaining a high-resolution map of a tile does not mean that a digital twin of that piece already exists.
The map is a characterization of one of its states.
To advance towards a quality-oriented twin, that information would need to be related to other data:
Powder state
↓
Pressing conditions
↓
Green tile map
↓
Drying conditions
↓
Glaze application
↓
Firing conditions
↓
Geometry and final properties
Only when we can maintain and leverage these relationships do we begin to build a digital representation capable of explaining product evolution.
This nuance is important because it avoids confusing advanced data capture with predictive capacity.
From reconstructing the past to anticipating the future
Traceability allows reconstructing:
what happened.
Analysis allows studying:
which variables were related.
Simulation and predictive models attempt to answer:
what could happen under certain given conditions.
The ASEBEC 4.0 Guide proposes precisely an evolution from connectivity and visualization towards higher levels of transparency, predictive capacity and adaptability. It also notes that predictive capacity depends on prior work done to integrate data and understand process interactions.
Therefore, prediction should not be understood as an artificial intelligence layer simply installed on top of a factory.
It needs a foundation.
Data.
Traceability.
Context.
Models.
And ceramic knowledge.
What “predictive quality” really means
A predictive quality tool does not necessarily have to issue a verdict:
“This tile will turn out defective.”
That binary approach usually oversimplifies a complex industrial process.
A prediction can consist of estimating:
- A trend.
- A probability.
- An expected interval.
- An increasing risk.
- A future property.
- Behavior under different scenarios.
For example:
- What shrinkage can be expected under certain conditions?
- Does the risk of a dimensional deviation increase?
- Which initial distributions appear most frequently associated with certain deformations?
- What would happen if we change a process condition?
- The value lies in providing the technician with useful information before the final result is consolidated.
Not in replacing their judgment.
Three ways to build predictive models
From a technical point of view, prediction can be approached through different strategies.
Physics-based models
They mathematically represent the mechanisms governing the process.
They can incorporate:
- Material properties.
- Heat transfer.
- Deformation.
- Densification.
- Viscosity.
- Shrinkage.
- Boundary conditions.
Their main advantage is that the prediction relies on an explicit representation of the physical phenomenon.
Data-driven models
They use production history to identify statistical relationships between inputs and outputs.
Here, the following can play a role:
- Regression.
- Multivariate methods.
- Machine learning.
- Neural networks.
- Anomaly detection.
Their capability largely depends on the quantity, quality, and representativeness of the data used to train and validate them.
Hybrid models
They combine physical knowledge and data-driven models.
This approach is particularly interesting when we understand part of the physics of the phenomenon, but the actual process exhibits complexity that is difficult to fully represent using equations.
There is no universally superior strategy.
The choice depends on the problem we want to solve, the available data, and the level of process knowledge.
A real example: simulating deformation during sintering
This relationship between initial state and final outcome can also be observed when studying the bulk density and dimensional stability of the tile, as internal differences in compaction can determine subsequent shrinkage, caliber or planarity.
In 2026, Balaguer et al. published in Ceramics International the work “Simulation of ceramic tile sintering using a modified SOVS model under industrial production conditions”.
The study develops an improved viscous sintering model —based on the SOVS model— applied to porcelain tile manufacturing and implements it using the finite element method.
The model allows studying the evolution of variables such as:
- Densification.
- Shrinkage.
- Geometric distortion.
Furthermore, it incorporates the effect of heterogeneities arising during pressing.
A particularly relevant aspect is that the work is not limited to idealized laboratory conditions.
Validation includes laboratory testing and industrial-scale trials, involving pressing and firing in industrial equipment and characterization of tiles before and after heat treatment.
The results obtained show that, within the conditions and materials studied, the model can reproduce with good agreement the evolution of densification, shrinkage and geometric distortions observed experimentally.
Precision of language is important here.
This work does not demonstrate that we can currently know with absolute certainty how any tile will emerge from the kiln.
It demonstrates something more concrete:
under defined conditions, it is possible to use a characterization of the initial state and a physical model to approximate the subsequent evolution of the piece.
That is a relevant step towards predictive quality.
The digital twin of sintering is already a specific line of research
The connection between simulation, measurement and digital twin is not merely a generic application of Industry 4.0 concepts.
In 2024, Chen et al. published in Journal of Materials Science a review entitled “A review of in-situ measurement and simulation technologies for ceramic sintering: towards a digital twin sintering system”.
The work jointly analyzes measurement technologies in situ and simulation models available to study sintering, and explicitly proposes a framework oriented towards a digital twin of the ceramic sintering process.
The logic is particularly relevant for our sector:
Physical process
→ measurement
→ data
→ model
→ simulation
→ comparison with the real process
→ knowledge update
In ceramics, this integration also presents a particular difficulty.
Not only does the machine state change.
The material also changes.
During firing, the microstructure, density, dimensions, and properties of the ceramic body evolve.
Therefore, a quality-oriented model should not only know what the kiln is doing.
It also needs information about what tile is entering it.
What information a quality-oriented ceramic digital twin could integrate
A specific architecture will depend on each factory, product and technical problem.
Not all variables will be necessary in all cases.
But, conceptually, a system oriented towards studying quality could link information coming from several stages:
- Raw material and spray-drying. Composition, moisture, particle size distribution, fluidity, batch or preparation conditions.
- Feeding and pressing. Press, mold, cavity, feeding parameters, pressure and compaction cycle.
- Green tile. Density, thickness, mass and, whenever possible, their spatial distribution.
- Drying. Temperature, time, moisture and relevant cycle conditions.
- Glazing and decoration. Recipe, applied quantity, application conditions and variables associated with the substrate.
- Firing. Thermal curve, speed, time, position and operating conditions.
- Final product. Dimensions, caliber, planarity, curvature, shade, classification or detected defects.
The goal is not to store everything just because it is technically possible.
It consists of retaining the variables capable of answering a specific industrial question.
Piece-by-piece traceability allows much more precise questions
Suppose a production run starts showing an increase in curvatures.
We could compare:
- Average batch density.
- Average moisture.
- Average temperature.
- Average curvature.
This can be useful.
But more detailed traceability would allow asking:
- Did tiles with greater deformation exhibit a specific density pattern before firing?
- Does the lower density area spatially coincide with the direction of deformation?
- Does the phenomenon appear only under certain pressing conditions?
- Does it occur in a specific position in the kiln?
- Is it repeated after a change in spray-dried powder?
- Does it disappear after modifying a specific parameter?
This change is fundamental.
We no longer study only production averages.
We study product histories.
Where does Tekinn fit into this evolution?
Here it is important to precisely differentiate between current capability and technological roadmap.
Currently, Tekinn works at a very specific stage that is particularly relevant to the subsequent knowledge of the product:
the characterization of the pressed piece before firing.
Through X-ray inspection and telemetry we obtain information on the distribution of:
- Density.
- Thickness.
- Mass.
This allows the technical team to make visible a heterogeneity that a surface inspection or an average value might not adequately represent.
The immediate value lies in using this information to better understand how the piece was formed, formulate hypotheses about a deviation, and verify the effect of adjustments made.
It is not necessary to talk about a digital twin for that data to already be useful.
But a second dimension exists.
If these characterizations can be linked in the future with process history and the subsequent behavior of the tiles, they become a particularly valuable source of information for more advanced analysis models.
Tekinn's roadmap considers precisely the future development of historical data analysis, advanced software, and artificial intelligence applied to tile behavior.
It is useful to maintain this distinction:
Today: we measure and characterize the piece at source.
Next level: relating those characterizations with manufacturing histories.
Evolution: researching and developing models capable of extracting patterns and anticipating behaviors under defined conditions.
When in this article we speak of predictive quality, we are therefore talking about a technological evolution of ceramic control and capabilities that are already demonstrating their viability in research.
It does not mean that Tekinn's current software automatically predicts the final result of every tile.
Technical sources
- ISO 23247-1:2021. Automation systems and integration — Digital twin framework for manufacturing — Part 1: Overview and general principles. Establishes general principles, terms, definitions and requirements for the digital twin framework for manufacturing.
ISO 23247-1:2021 – ISO - ISO 23247-5:2026. Automation systems and integration — Digital twin framework for manufacturing — Part 5: Digital thread for digital twin. Develops the concept of digital thread to enable the creation, connectivity, management and maintenance of manufacturing digital twins throughout the product life cycle. The standard was published in June 2026.
ISO 23247-5:2026 – ISO - ISO 23247-6:2026. Automation systems and integration — Digital twin framework for manufacturing — Part 6: Digital twin composition. Addresses communication, aggregation and interoperability between different digital twins and distinguishes integrated, unified and federated compositions. It was published in July 2026.
ISO 23247-6:2026 – ISO - ASEBEC / Institute of Ceramic Technology (ITC-AICE). ASEBEC 4.0 Guide. Sectorial document to guide the transformation of the ceramic industry towards Industry 4.0. It includes connectivity and sensing, data visualization, digital twin, advanced data analytics and machine learning. The guide itself incorporates process variables necessary to build the digital twin of different ceramic manufacturing stages.
Download ASEBEC 4.0 Guide – PDF - Chen, B., Ren, X., Diao, Q., Zou, H., Shi, X., Sui, T., Lin, B. & Yan, S. (2024). A review of in-situ measurement and simulation technologies for ceramic sintering: towards a digital twin sintering system. Journal of Materials Science, 59(29), 13393–13432. DOI: 10.1007/s10853-024-09986-7.
Article – Springer / DOI - Balaguer, J., Tiscar, J. M., Boix, J., Olmedilla, A., Moreno, A. & Gilabert, F. A. (2026). Simulation of ceramic tile sintering using a modified SOVS model under industrial production conditions. Ceramics International, 52(13, Part B), 22191–22216. DOI: 10.1016/j.ceramint.2026.03.287. The work develops and industrially validates a modified SOVS model to simulate densification, shrinkage and deformations during firing of porcelain stoneware.
Article – ScienceDirect - Amorós, J. L. et al. (2010). Non-destructive measurement of bulk density distribution in large-sized ceramic tiles. Journal of the European Ceramic Society, 30(14), 2927–2936. DOI: 10.1016/j.jeurceramsoc.2010.01.033. Presents an X-ray absorption system to non-destructively obtain complete maps of bulk density and thickness distribution in large-format ceramic tiles.
Article – ScienceDirect