

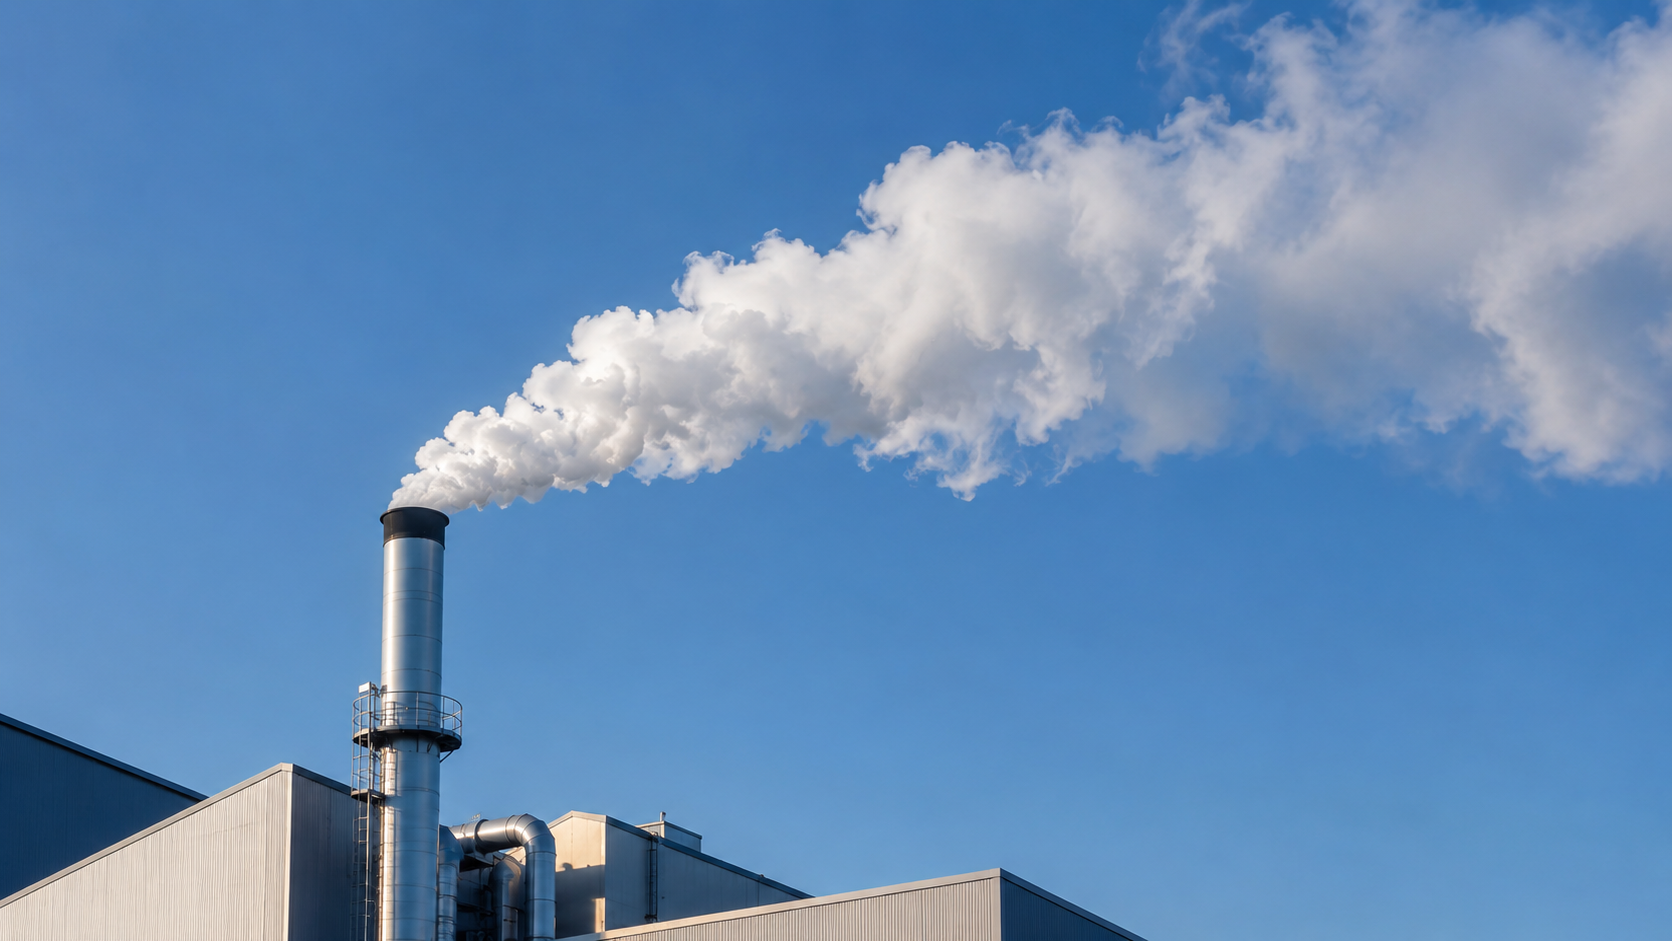
The cost of CO₂ is already part of the ceramic industry's profit and loss account.
In 2024, the Spanish ceramic tile manufacturing sector recorded an emissions allowance bill of nearly €37 million, 211% higher than in 2023. The increase was not due to a rise in the average price of emissions allowances—ASCER puts the 2024 average at €65.29/t CO₂, 22% lower than the previous year—but mainly to a 15% decrease in the free allocation received by the sector, which increased the number of allowances companies had to purchase.
The pressure continues in 2026. For the February–July period this year, the European Commission put the average price of emissions allowances at €74.66/t CO₂. Meanwhile, European ceramic industry associations have stepped up their warnings about the impact that developments in the EU ETS could have on the sector's competitiveness.
How much energy, material and CO₂ do we invest in a tile before discovering a process deviation that could have been detected at an earlier stage?
In an energy-intensive process such as ceramic manufacturing, reducing emissions does not depend solely on changing the energy source or installing new kilns.
It also depends on making better use of every unit of energy the plant already consumes. This is where quality, productivity and control at source start to become part of the same conversation.
The EU ETS is not exactly a “CO₂ tax”
Before analysing the relationship between productivity and emissions, it is useful to clarify how the European system works.
The EU Emissions Trading System (EU ETS) is an emissions trading system based on the principle of cap and trade.
The European Union sets an overall emissions cap for the activities covered by the system. This cap is expressed in emissions allowances, and each allowance covers one tonne of CO₂ equivalent.
Installations covered by the EU ETS must monitor and verify their emissions annually and surrender enough allowances to cover them. Some of these allowances may be received through free allocation under the applicable rules, while the remainder must be purchased on the market. Allowances can also be bought, sold or held for future use within the rules of the system.
Therefore, from a technical perspective, this is not a fixed tax that a company pays simply for emitting CO₂.
It is a carbon market. This has a direct economic consequence:
The more verified emissions an installation needs to cover and the lower its free allocation, the greater its exposure to the cost of emissions allowances.
The ceramic industry is particularly sensitive to this situation because of its heavy reliance on thermal processes. According to Cerame-Unie, more than 1,200 European ceramic installations are covered by the EU ETS. Although they account for approximately 10% of the industrial installations included in the system, they generate around 1% of its industrial emissions. Energy can account for up to 30% of production costs in certain ceramic subsectors.
Why there is so much concern in the sector in 2026
The pressure does not come solely from the market price of CO₂.
The number of free allowances each installation receives also matters.
In its report on 2024, ASCER explains that the fall in production in previous years led to a 15% reduction in free allocation for the Spanish sector. This increased the need to purchase allowances, bringing the sector's CO₂ bill to approximately €37 million.
In 2026, Cerame-Unie and the European Ceramic Tile Manufacturers' Federation (CET) warned about the impact of updating the EU ETS benchmarks. According to the sector, the methodology initially considered by the Commission could increase European tile manufacturers' carbon costs by approximately 34%. The industry has called for a specific methodology that better reflects the actual decarbonisation potential of the ceramic manufacturing process. The association called for the 2025 benchmark levels to be maintained to avoid additional cost pressure. This figure represents the sector's position and estimate; it should not be interpreted as a definitive reduction applying equally to all ceramic installations.
The regulatory framework also continues to evolve.
The 17 July 2026, the European Commission presented a proposal for a targeted revision of the EU ETS aimed at reconciling the 2040 climate target with industrial competitiveness. Among other elements, the proposal includes changes relating to free allocation and incentives for industrial decarbonisation.
The future cost of carbon will therefore depend on multiple regulatory and market variables.
But there is one variable the factory can work on directly: its production efficiency.
The ceramic industry has already significantly reduced its specific emissions
Talking about decarbonisation does not mean starting from scratch.
The Spanish tile industry has made substantial efforts to improve energy efficiency over several decades.
According to ASCER, the sector's specific emissions have fallen by approximately 61% since 1980, from 14.2 kg of CO₂ per m² to around 5.6 kg of CO₂ per m² in recent years.
The 2024 sector report also shows the extent to which thermal energy remains a key factor: approximately 90% of the energy consumed in Spanish tile manufacturing comes from gas, compared with 10% from electricity. Gas consumption reached around 13 TWh that year.
This energy structure explains why any improvement in the use of thermal energy has economic and environmental significance.
However, it also requires a crucial distinction.
Does higher productivity automatically mean lower CO₂ emissions?
Not necessarily.
This distinction matters if we are to avoid an oversimplified claim.
In a continuous ceramic kiln, energy is consumed to maintain the thermal conditions required by the process. Removing a single potentially defective tile before it enters the kiln does not mean that the kiln's gas consumption automatically falls by the exact amount of energy that tile would have required.
It would therefore not be technically accurate to state:
“Each tile identified as defective in its unfired state directly saves X kg of CO₂.”
The relationship does not work that way in the short term.
What can happen is different and far more relevant from an industrial perspective.
Improved process control can help to:
- Increase the percentage of conforming product obtained from the same production output, thereby reducing CO₂ intensity per saleable unit; and, when that increase in yield means less gross output is needed to obtain a given quantity of first-quality product, also reduce energy consumption and absolute emissions over the period analysed.
These are two different effects.
They should be measured separately.
First effect: reducing CO₂ per square metre of first-quality product
Suppose a plant manufactures 100 units and obtains 90 conforming units.
If the process emissions are allocated only to those 90 conforming units, each one indirectly bears a share of the CO₂ generated in manufacturing the ten rejected units as well.
If, under comparable production conditions, the factory manages to obtain 92 conforming units from the same 100, process efficiency improves.
Even if total emissions over the period remained almost unchanged, there would be more conforming product across which to allocate them.
Specific carbon intensity would be lower.
We can express this simply:
First-quality yield
η = conforming output / total output
CO₂ intensity of conforming product
I CO₂ = verified emissions / conforming output
If first-quality yield increases while all other variables remain constant, the amount of CO₂ associated with each conforming unit decreases.
This indicator is particularly useful because it reflects actual efficiency more accurately than dividing emissions by total gross output alone, including tiles that will ultimately be rejected.
Second effect: needing less gross output to obtain the same amount of saleable product
There is a second potential effect.
Suppose a plant needs to deliver 1,000,000 m² of conforming product.
At a yield of 90%, it would need to manufacture approximately: 1,111,111 m² of gross output.
If it manages to increase yield to 92%, it would need approximately: 1,086,957 m² of gross output.
The difference is around: 24,155 m² of gross output.
In other words, approximately 2.17% less gross output to obtain the same million square metres of conforming product.
This example is deliberately simplified.
It does not mean that emissions will fall by exactly 2.17%, because energy consumption does not always scale linearly with production volume, and thermal loads and fixed consumption must also be considered.
However, it correctly illustrates the economic mechanism:
If a plant needs to process less gross output to obtain the same amount of saleable product, there is potential to reduce raw material use, energy consumption, operating hours and associated emissions.
The actual reduction must be verified using the installation's own energy consumption data and verified emissions.
Products rejected at the final stage have an accumulated footprint
The stage at which we detect a deviation also matters.
The difference between detecting a problem before or after the kiln also has an economic dimension. In our analysis of reactive and preventive control and the ROI of reducing rejects before the kiln we explain how the stage at which a problem is detected determines the value already invested in the tile.
A tile rejected immediately after pressing has not accumulated the same resources as a tile rejected after firing, grinding or sorting.
As a tile progresses along the line, different resources and operations are incorporated:
raw material → pressing → drying → glazing and decoration → firing → finishing → sorting.
If the problem is discovered at the end, the resources used in earlier stages can no longer be fully recovered.
From a CO₂ perspective, firing is particularly relevant because of its thermal intensity.
This leads to a different question from the traditional one:
Could we have known earlier that the process was creating a condition that increased the risk of rejection at a later stage?
This is where control at source adds value.
Many deviations that appear later may be related to the condition of the pressed tile
The tile entering the kiln does not start from a neutral state.
To interpret these relationships correctly, it is useful to understand the main defects that can occur during ceramic tile manufacturing and the stages at which they may begin to develop.
During feeding and pressing, variations may arise in the distribution of density, thickness, and mass.
Possible causes include differences in mould filling, trapped air, certain feeding conditions or an uneven distribution of pressing pressure.
These variations can affect the tile's subsequent behaviour.
One of the clearest examples is the relationship between bulk density and dimensional stability, where internal differences in compaction can contribute to variations in shrinkage, calibre or flatness.
How to measure whether a quality improvement is actually reducing CO₂ intensity
To avoid generic environmental claims, the plant should quantify the effect.
A basic assessment can start with four variables:
| Variable | What we need to measure |
| Gross output | m² or tonnes processed |
| Conforming output | m² or tonnes of first-quality product |
| Energy consumption | gas and electricity over the comparable period |
| Emissions | direct emissions verified or calculated using the applicable methodology |
These can be used to develop indicators such as:
Yield
Conforming output / Gross output
Specific thermal energy consumption per unit of gross output
kWh of gas / m² produced
Thermal energy consumption per unit of conforming product
kWh of gas / conforming m²
Specific emissions per unit of gross output
kg CO₂ / m² produced
Specific emissions per unit of conforming product
kg CO₂ / conforming m²
The last indicator is particularly useful for analysing the impact of rejects.
A plant may achieve only a small improvement in energy consumption per square metre of gross output, yet significantly improve consumption and emissions per saleable square metre if it manages to increase the percentage of first-quality product.
Demonstrating a CO₂ reduction requires a comparison of equivalent periods
Here too, there is a risk of misinterpreting the data. It would not be enough to compare:
“before Tekinn” with “after Tekinn”, without controlling for other variables.
To attribute an improvement correctly, production runs should be compared that are equivalent, as far as possible, in tile format, composition, thickness, production volume, firing curve, kiln conditions and energy mix.
It is also useful to distinguish between:
- absolute emissions, expressed in tonnes of CO₂;
- specific emissions, expressed per tonne or square metre produced;
- specific emissions per unit of conforming product, which take quality yield into account.
The three metrics answer different questions.
A plant could reduce its CO₂ intensity while increasing its absolute emissions because it has produced much more.
Alternatively, it could keep its total emissions almost unchanged while significantly improving its footprint per square metre of first-quality product. Without this distinction, it is easy to draw incorrect conclusions.
Technical sources
- European Commission — EU Emissions Trading System. Official documentation on how the EU ETS works, the principle of cap and trade, the obligation to monitor emissions and surrender an equivalent number of allowances, and how free allocation works. On 17 July 2026, the Commission also presented a new proposal for a targeted revision of the system.
- European Commission — Auctioning of allowances. For the February–July 2026 period, the official indicator published by the Commission puts the average allowance price at €74.66/t CO₂.ASCER — 2024 report on production, energy and CO₂. The report records a sector-wide emissions allowance bill of nearly €37 million in 2024, a 211% increase compared with 2023, a 15% reduction in free allocation and an average allowance price of €65.29/t. It also puts the Spanish sector's combined energy and CO₂ bill at approximately €829 million that year.
- Cerame-Unie — Climate & Energy. The European association states that the EU ETS includes more than 1,200 ceramic installations, accounting for around 10% of the installations covered and approximately 1% of the system's industrial emissions.
- Cerame-Unie — European Council conclusions on EU ETS and carbon costs, March 2026. A document reflecting the sector's concerns about changes to the benchmarks and free allocation for 2026–2030.