In the ceramic industry, not all defects cost the same.
The real cost of a deviation does not depend solely on the type of defect, but on the moment it is detected. Identifying a problem in the pressed piece, before it enters the dryer or the kiln, is not the same as discovering it after it has already gone through firing, grinding, sorting, or packaging.
In the first case, there is still room to react.
In the second, the piece has already accumulated costs of raw materials, energy, line time, glaze, handling, and productive capacity.
That is why more and more ceramic plants are evolving from a model of reactive control, focused on detecting and classifying defects at the end of the process, toward a model of preventive control at source, based on identifying critical signals before the defect advances along the line.
In this article we analyze the difference between both approaches and propose a simple methodology to calculate the ROI of preventive control applied to the reduction of waste before the kiln.
Why the moment of detection changes the real cost of the defect
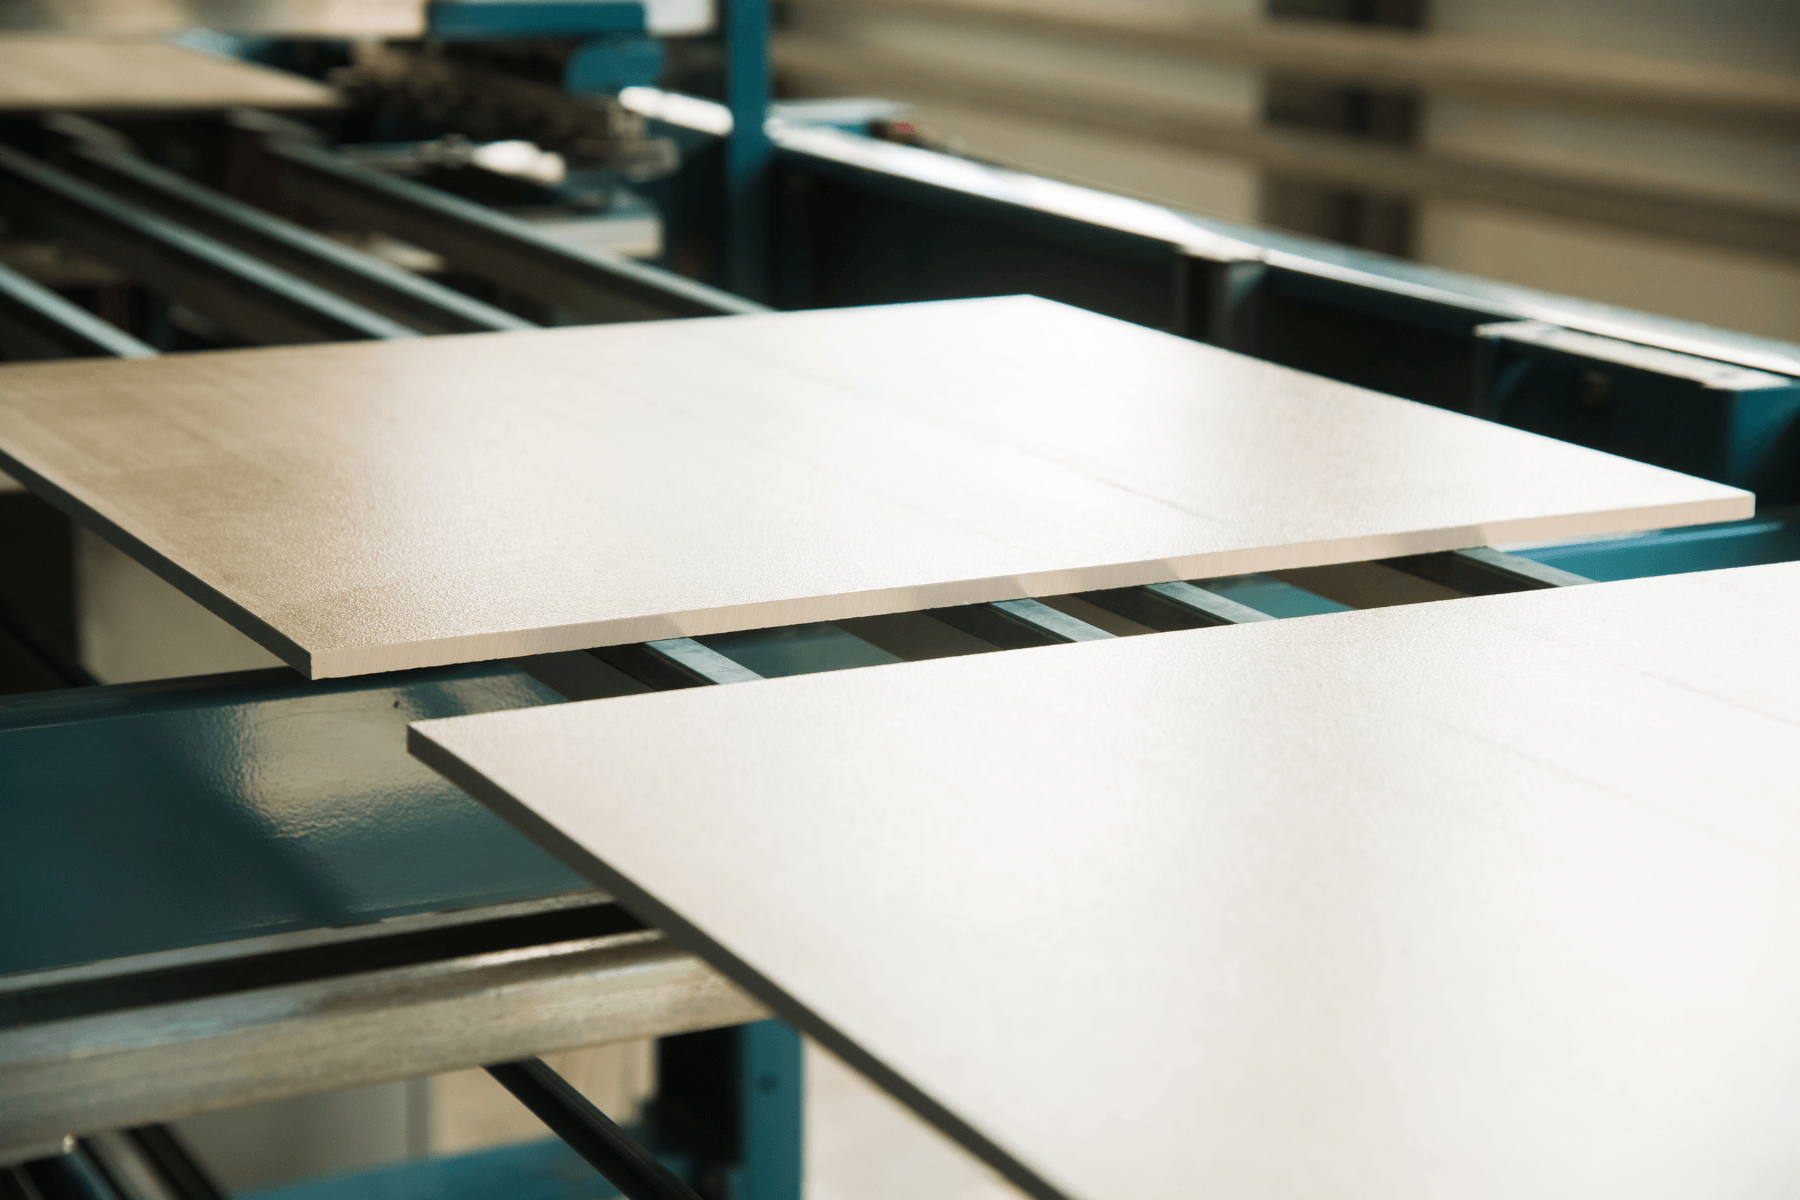
On a ceramic line, the piece gains value as it advances through the production process.
A freshly pressed piece has not yet consumed all the thermal energy of the kiln, has not received subsequent glazes or decorations, has not occupied sorting capacity, and has not generated costs associated with grinding or packaging.
However, when a defective piece reaches the final stages, the cost of rejecting it is much higher.
The cost of detecting late
Reactive control allows defects to be identified when they are already visible or measurable in advanced stages of the process.
It can be useful for separating non-conforming products, avoiding complaints, or protecting the final quality delivered to the customer. But it has an important limitation: it detects the problem when the cost has already been consolidated.
In this scenario, the plant does not only lose a piece. It also loses:
- energy consumed in production;
- processed raw materials;
- applied glazes and decorations;
- line time;
- productive capacity;
- internal handling;
- sorting, grinding, or packaging costs;
- and, in some cases, commercial margin if the defect affects the percentage of first quality.
Reactive control helps to classify.
But it does not always help to prevent the cost from occurring.
The cost of detecting at the source
Preventive control changes the point of intervention.
Instead of waiting for the defect to appear in firing, grinding, or sorting, it looks for early signals in the pressed piece. Especially those related to the distribution of density, thickness, and mass, critical factors for the subsequent behavior of the tile.
When a deviation is detected in the green stage, the plant can act sooner:
- adjusting pressing parameters;
- reviewing the mold load;
- identifying areas of low compaction;
- detecting trapped air;
- correcting non-homogeneous thickness;
- or preventing an entire batch from advancing with the same defect pattern.
The economic difference is clear: the earlier a deviation is detected, the lower the accumulated cost of the waste.
Reactive control vs. preventive control in the ceramic industry
Ceramic quality control is not just about detecting defects. It is about deciding when they are detected, what information they provide y what reaction capacity they allow.
What we mean by reactive control
Reactive control is that which acts when the defect has already manifested itself.
It usually appears in stages such as:
- kiln exit;
- sorting;
- surface inspection;
- grinding;
- final inspection;
- packaging;
- or even a subsequent customer complaint.
This type of control follows a verification logic: checking whether the piece meets or does not meet the established requirements.
It is necessary, but it has a limitation: in many cases, when it detects the problem, the plant can no longer correct the cause on that piece or on part of the produced batch.
What we mean by preventive control
Preventive control seeks to detect early signals before the defect materializes.
In the case of ceramic tiles, a relevant part of subsequent problems may be related to what happens during pressing: non-homogeneous compaction, poor distribution of mass or thickness, trapped air, etc. — in short, internal variations that are not always visible on the surface.
During pressing, conditions such as poor mold loading, dirt on the grate, poor deaeration, inadequate mold entry speed, or non-homogeneous pressing pressure may arise. These conditions can generate an irregular distribution of density, thickness, and mass in the pressed piece.
The preventive control is not limited to saying whether a piece is good or bad. Its value lies in providing information to understand what is happening in the process.
Key difference: classifying the defect or correcting the cause
The difference between both approaches can be summarized as follows:
| Aspect | Reactive control | Preventive control |
| Detection moment | After the defect manifests itself | Before the defect advances |
| Usual stage | Firing, sorting, grinding, or final inspection | Pressed piece / green piece |
| Main objective | Separate conforming and non-conforming products | Detect deviations and correct the cause |
| Type of information | Final result | Early process signal |
| Economic impact | Reduces risk of delivering defective product | Reduces accumulated cost of waste |
| Reaction capacity | Limited | High |
| Value for plant | Output control | Process stability |
Reactive control separates pieces.
Preventive control stabilizes processes.
And that difference is what turns source control into a profitability tool.
What defects can generate waste if not detected before the kiln
A non-homogeneous distribution of density, thickness, and mass in the pressed piece can cause different behaviors during drying, glazing, and firing.
This means that a defect that seems to appear at the end of the process may have its origin much earlier.
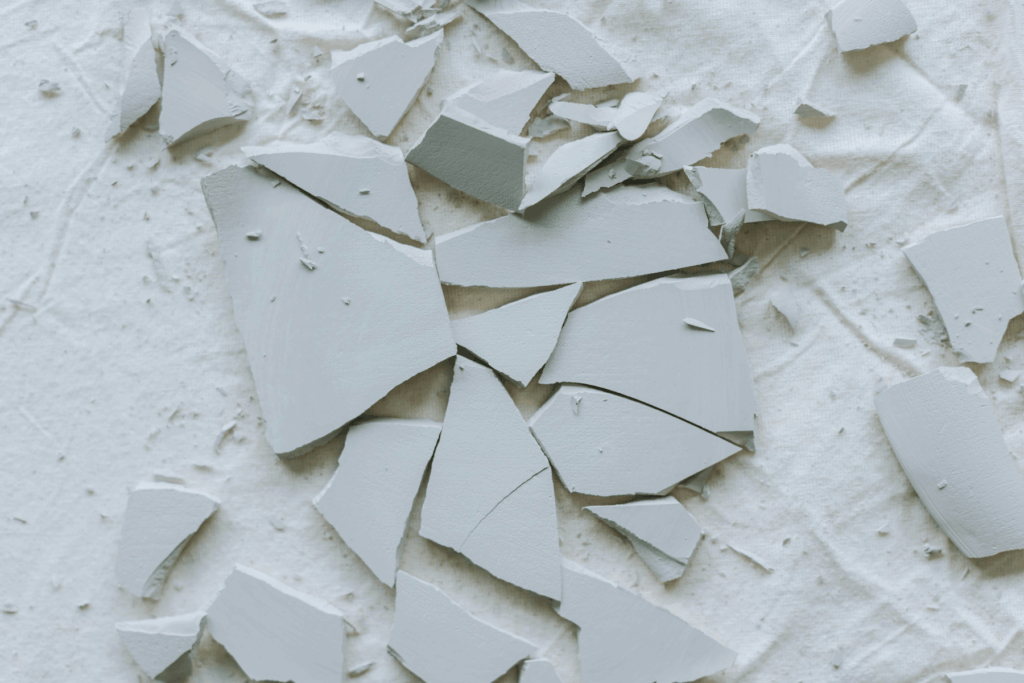
Breakages during handling or internal transport
When there are areas with lower apparent density, the mechanical strength of the green piece decreases.
This can cause breakages when leaving the press, fractures during internal transport, or problems at the dryer entrance. Technically, low compaction implies fewer contact points between particles and, therefore, lower cohesion of the ceramic body.
From an economic standpoint, these breakages generate direct waste and can cause micro-stoppages, accumulations, or efficiency losses on the line.
Cracks in drying, firing, or grinding
Density differences within the same piece can cause different shrinkage rates.
A less compacted area may behave differently from a more compacted area during drying or firing. This difference generates internal stresses that can lead to cracks, fissures, or micro-cracks that are not always visible in the early stages.
In high-value or large-format products, this type of deviation is especially critical, because the accumulated cost of the piece increases at each stage of the process.
Differences in glaze absorption
Density is directly linked to the porosity of the piece.
Areas of lower density tend to have higher porosity, which can cause different glaze absorption. This can translate into tone differences, more matte or glossy areas, shadows, surface spots, or variations in the development of reactive glazes.
In these cases, the defect may manifest visually later, but its origin may lie in an internal heterogeneity of the pressed piece.
Deformations, curvatures, and loss of caliber
Density differences can cause differential shrinkage during sintering.
As a result, longitudinal curvatures, transverse curvatures, helical pieces, loss of flatness, or dimensional differences may appear.
On sorting or grinding lines, this can translate into higher rejection, dimensional dispersion, or difficulty maintaining stable calibers.
Internal delaminations and pitting
Some structural defects are not externally visible before firing.
This is the case with internal delaminations or pitting, which can be caused by trapped air during pressing or by compaction differences between layers. Their consequences may appear later in the form of delaminations, breakages during cutting, or structural weakening.
This is where surface inspection finds an obvious limitation: if the defect is inside the piece, looking only at the surface is not always sufficient.
How to calculate the ROI of reducing waste before the kiln
To justify an investment in preventive control, it is necessary to translate the technical data into economic impact.
The objective is not only to calculate how much a machine or inspection system costs. The objective is to calculate how much the plant can save by reducing defects before they advance along the line.
Step 1: calculate the current cost of waste
The first step is to determine the current cost of waste associated with late-detected defects.
To do this, we can start with these variables:
| Variable | Description |
| Monthly production | m² or pieces produced per month |
| Rejection percentage | % of non-conforming product |
| Average cost per m² or piece | Accumulated cost up to the detection point |
| Detection stage | Green, drying, firing, grinding, sorting |
| Defect type | Breakage, crack, caliber, tone, deformation, delamination |
| Margin or avoided cost | Economic value of recovering first quality or avoiding rework |
An initial formula would be:
Monthly waste cost = monthly production x % rejection x accumulated cost per m²
Indicative example:
- Monthly production: 200,000 m²
- Rejection associated with late-detected defects: 3%
- Average accumulated cost per rejected m²: €7
Monthly waste cost = 200,000 x 0.03 x €7 = €42,000
Annual waste cost = €42,000 x 12 = €504,000
This figure does not yet represent the ROI, but it allows the scale of the problem to be assessed.
Step 2: identify what portion of the waste originates in pressing
Not all waste in a ceramic plant originates in pressing.
However, a portion of subsequent defects may be related to heterogeneities generated in the pressed piece: density, thickness, mass, compaction differences, trapped air, or internal stresses.
Therefore, the next step is to estimate what percentage of the current waste could be linked to deviations detectable in the green stage.
Indicative example:
- Annual cost of late-detected waste: €504,000
- Estimated percentage originating in pressing: 50%
Potentially addressable waste = €504,000 x 0.50 = €252,000 / year
This figure must be validated with plant records, defect analysis, and technical tests.
Step 3: estimate the potential reduction in rejection
Once the potentially addressable waste has been identified, improvement scenarios can be proposed.
It is advisable to work with three levels:
| Scenario | Estimated reduction of addressable waste | Estimated annual savings |
| Conservative | 15% | €37,800 |
| Medium | 30% | €75,600 |
| Optimistic | 50% | €126,000 |
These percentages should be estimated based on what the technical team of a production plant considers achievable from their current data.
Step 4: convert the first quality improvement into annual savings
The reduction in waste should not only be measured as "less rejection".
It can also be measured as:
- increase in the percentage of first quality;
- reduction of rework;
- fewer stoppages or repeated adjustments;
- greater production capacity.
This means the company obtains greater profits from the sale of a higher-quality product with a higher commercial margin, and can also manufacture more m² annually, which translates into higher sales.
Annual benefit = recovered m² x profit margin per m²
Indicative example:
- Annual production: 2,400,000 m²
- Improvement in first quality and increase in productive capacity: 0.5%.
- Recovered m²: 12,000 m²
- Economic value recovered per m²: €7
Annual savings = 12,000 x €7 = €84,000
If the improvement were 1 percentage point:
Annual savings = 24,000 x €7 = €168,000
This type of calculation helps explain why small percentage improvements can have a significant impact in high-volume plants.
Step 5: compare the annual savings with the investment
Once the annual savings have been estimated, we can calculate the ROI.
The basic formula is:
ROI = [(Estimated annual savings – annualized investment) / investment] x 100
The payback period can also be calculated:
Payback = investment / estimated annual savings
Indicative example:
- Total investment: €180,000
- Estimated annual savings: €160,000
Payback = €180,000 / €160,000 = 1.12 years
In this scenario, the investment would be recovered in approximately just over one year.
If the annual savings were higher due to the reduction of defects in high-cost stages, the payback period would decrease.
Why X-ray inspection helps to anticipate the problem
X-ray inspection allows the ceramic piece to be analyzed from a volumetric perspective, not just a surface one.
At Tekinn we work with inspection applied to the pressed piece before firing, obtaining information on density, thickness, and mass distribution. This capability aligns with the strategic objective of controlling the process at the source and maximizing the existing productive infrastructure.
Density, thickness, and mass maps in the pressed piece
Distribution maps allow visualization of areas where the piece does not behave homogeneously.
These heterogeneities may be related to loading problems, compaction issues, poor deaeration, or non-uniform pressure distribution. If not corrected, they can lead to subsequent defects in drying, glazing, firing, grinding, or sorting.
The advantage is not just in seeing the defect.
The advantage is in detecting an early signal before the problem becomes consolidated waste.
From intuition to technical data
The experience of the plant team remains fundamental.
The knowledge of the operator, the quality manager, or the technical director provides context, judgment, and interpretive capacity.
But data allows that experience to be reinforced with objective, comparable, and traceable information.
Instead of relying solely on visible symptoms or intuition-based adjustments, the team can work with internal evidence from the piece. This facilitates faster decisions and reduces uncertainty in format changes, press adjustments, or analysis of recurring defects.
Correction at the source: the real impact on ROI
The ROI of preventive control does not come solely from detecting individual defects.
It comes from reducing the plant's reaction time.
If a deviation is detected after the kiln, the correction window arrives too late. If it is detected in the pressed piece, the team can intervene before the defect multiplies.
In economic terms, this means:
- fewer defective pieces processed;
- lower unproductive energy consumption;
- lower accumulated cost per rejection;
- greater stability of first quality;
- less dependence on final inspection;
- greater capacity to prevent repetitive defects;
- and greater production capacity.
Preventive control is not a cost, it is a profitability tool
For years, ceramic quality control has been understood primarily as a verification stage: checking, classifying, and separating.
But in an environment where margins are increasingly tight, formats more demanding, and energy costs more relevant, detecting late is no longer enough.
Reactive control reports the problem.
Preventive control helps to prevent it from advancing.
That is why calculating the ROI of reducing waste before the kiln requires looking beyond the price of the technology. The key question is not just how much it costs to inspect, but how much it costs not to detect in time.
When a plant is able to identify heterogeneities in density, thickness, and mass in the pressed piece, it gains reaction capacity. And that capacity can translate into less rejection, more first quality, and greater production stability.
En Tekinn we help ceramic plants move from symptom-based correction to data-driven preventive analysis.
Source control to produce with more knowledge, less waste, and greater profitability.
Do you want to calculate the potential impact of preventive control on your line?
Request a technical demo and we will analyze how X-ray inspection can help you detect deviations before the kiln.